Using Satellite Imagery Data to Improve Building Location Accuracy

Imperviousness Layer from Copernicus - https://land.copernicus.eu/pan-european/high-resolution-layers/imperviousness
Challenge
It would be nice to be able to analyse the previously generated Fire Station Time Tavel Boundaries against a high-resolution view of residential patterns. We have a few options in order to achieve this, as follows;
Address Data
The best and most accurate method would be to use address data from Geodirectory, the Irish postal service’s addressing data product. Using this it would be possible to extract spatial data of all residential buildings, and the number of associated residential address points per building. This would give the most accuracy. However, this is a licensed product and would incur a cost for use. Most organisations that are doing any kind of spatial analysis with respect to where people live would be using this data.
Census data
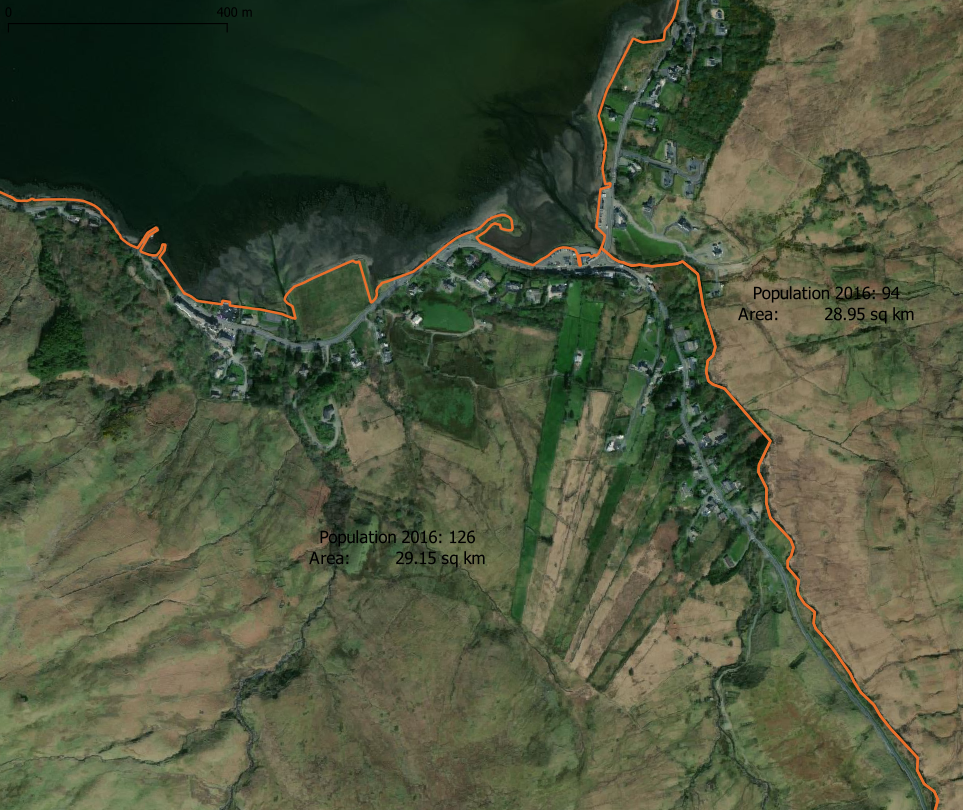
The Census Data is very reliable but it has a drawback in that it is only useful to a certain scale. For urban areas, such as our main towns and cities, that is fine as the Small Areas are densely populated and one can assume that the population is relatively evenly dispersed within the Small Area. But for rural and remote areas, there can be significant clustering of population contained within a larger Small Area polygon. In the images below of a Small Area in Kilkenny and one in Leenaun, there is a similar population (168 vs 126) yet a differential of 728 times in the area covered, virtually all of the settlement in the Leenaun Small Area occurring in the Northeastern extreme.
So for analysis which needs any sort of granularity, the Census Data is not ideal.
remote sensing
There is a way to supplement the Small Area demographic data and obtain a higher resolution of settlement information, without resorting to purchasing data. The Copernicus project
is the European Union's Earth observation programme, looking at our planet and its environment to benefit all European citizens. It offers information services that draw from satellite Earth Observation and in-situ (non-space) data.
It is possible, after registering as a user, to download high resolution satellite data from the Copernicus project. This has many forms and use-cases and can be used in emergency management, land-use management and pollution and resource monitoring. there are several derived datasets such as the Corine and-use product, the Imperviousness product and the European Settlement Map product. These three are of interest to us as they can be used in combination with the CSO Small Area polygons to identify settlement concentrations.
Copernicus Products
European settlement map
ESM data is a raster dataset, indicating the percentage built-up area per pixel, and is derived from SPOT 5 and SPOT 6 imagery, in combination with Open Street Map building polygon data using a machine learning process to best identify features. Unfortunately, performing some ground-truthing on this product in an Irish context shows that it has some deficiencies - this is probably due to the incomplete (but continually improving)coverage of Open Street Map building identification throughout Ireland. This data is probably more relaible in built-up areas, but has variable consistency across more rural or remote regions.
Corine LAND cOVERAGE
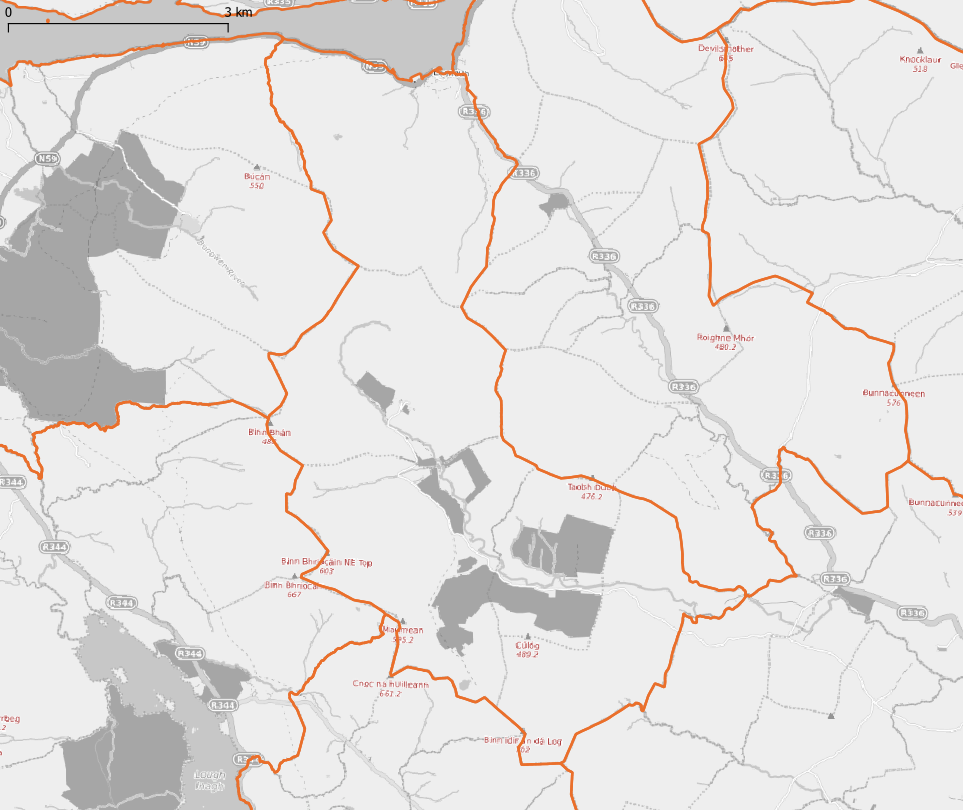
The CLC dataset is a vector layer, classified under multiple land-use headings. For the purposes of this analysis, I have built a rough grouping table for all the CLC classifications encountered in Ireland (there aren’t many olive groves cultivated here, for example….). A snapshot of Connemara classified under these headings in the 2018 data is shown below:

Connemara region, classified under broad CLC headings.
We can utilise this data by calculating the proportion of each Small Area that is made of of the broad grouping category as above. I ran the intersection of the Small Area and Corine polygons in QGIS, and read a csv version of this file into R. the following code produces the Small Area Landcover Proportion dataset.
sa_landcover <- read_csv("../data/corine_sa_intersections.csv")

# corine landcover groups
corine_glossary <- readxl::read_xlsx("C:/DataDump/Corrine_Ireland/Corrine_Legend.xlsx") %>%
  select(Code18, Meaning, Grouping)


sa_landcover_prop <- sa_landcover %>%
  mutate(Code18 = as.character(Code_18)) %>%
  left_join(corine_glossary)  %>%
  group_by(GUID, Grouping) %>%
  mutate(sa_area_by_landcover_group = sum(area)) %>%
  group_by(GUID) %>%
  mutate(total_sa_area = sum(area),
         prop_landcover = sa_area_by_landcover_group/total_sa_area) %>%
  ungroup() %>%
  distinct(GUID, Grouping, prop_landcover) %>%
  pivot_wider(GUID,
              names_from = Grouping,
              values_from = prop_landcover) %>%
  mutate_if(is.double, ~replace_na(., 0))
This results in the following table:

Excerpt of land cover proportion table, by Small Area.
For the purposes of this analysis, it would probably be appropriate to just take an “urban/non-urban” split. In any case, my feeling on this data is that it is still a bit coarse to allow a deep enough level of analysis.
imperviousness
The Imperviousness dataset is a raster dataset available at a highest resolution of 10m pixel, and representing the extent of sealing of a given land-cover area:
Sealed/Impervious areas are characterized by the substitution of the original (semi-) natural land cover or water surface with an artificial, often impervious cover. These artificial surfaces are usually maintained over long periods of time. The imperviousness HRL captures the spatial distribution of artificially sealed areas, including the level of sealing of the soil per area unit. The level of sealed soil (imperviousness degree 1-100%) is produced using a semi-automated classification, based on calibrated NDVI.
This dashboard from Copernicus is a simple interactive tool to explore the level of sealing at various scales. It shows Ireland is middle of the table, with 1.19% of total land cover sealed.
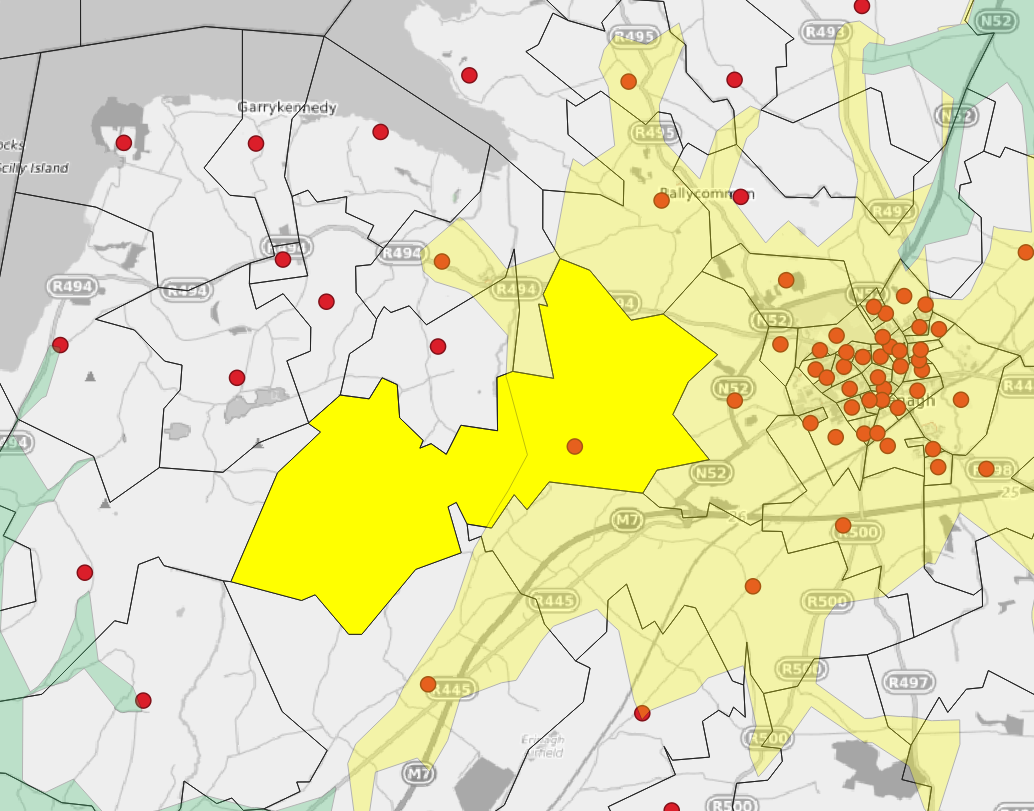
In my opinion, this dataset could be very useful to indicate areas within a Small Area where population is concentrated. To use the previous example of Leenaun, and showing the ESM, Corine and Imperviousness datasets, it is obvious that the use of the Imperviousness data yields the most accuracy. It oculd be said that the likelihood of an area having a settlement is related to the degree of imperviousness.


Conclusion
The two most useful satellite data products are the Corine Land Cover vector dataset, and the Imperviousness raster dataset. Some processing will be required to marry these datasets to the Small Area geographies, one of which (the Corine Land Cover) is detailed above and one which follows;
Processing the imperviousness data
Before performaing any analyis of the Imperviousness layer against our other data, it is necessary to perform some preprocessing. The steps followed were;
Download the tiles for Ireland, which are delivered as around 20 tiles in the EPSG:3035 - ETRS89-extended / LAEA Europe - Projected projection. The download can be performed here.
Create a virtual raster which encompasses the set of tiles
Use the EXPORT tool to save the virtual raster with EPSG:2157 projection, and to re-assign values above 100 (non-land areas seem to have a imperviousness of 255) as no-data values
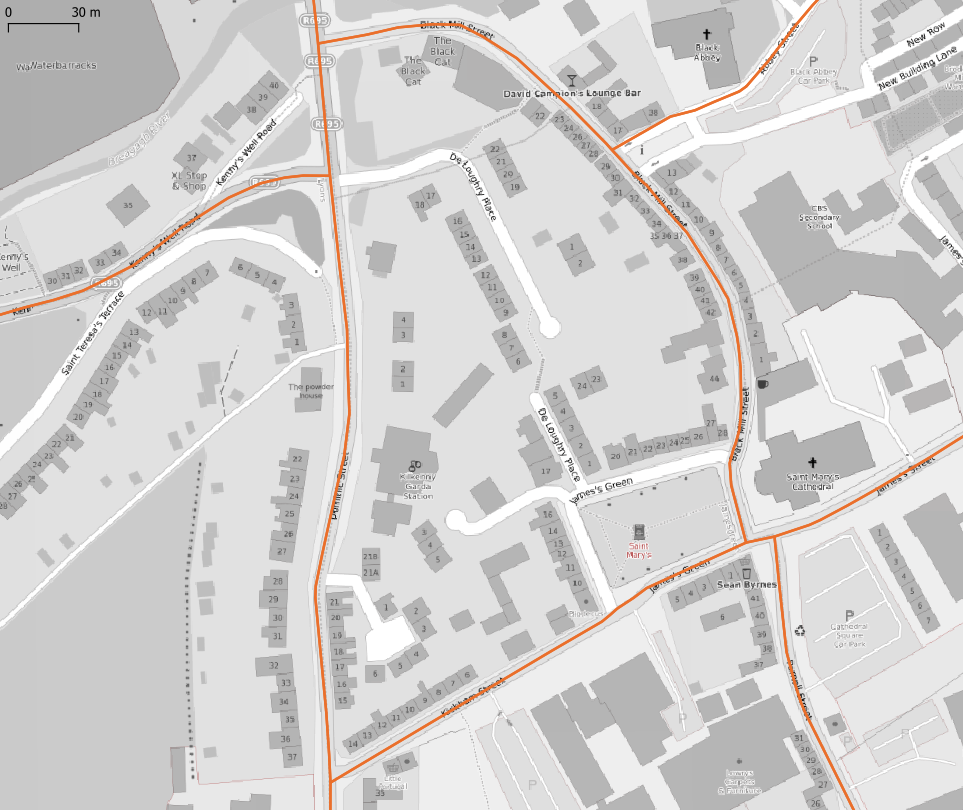
The resultant dataset is very satisfactory, and appears to give a decent representation of built-up residential areas, and industrial areas.

Greater Dulbin Area imperviousness.
The next step will be to validate the use of this data as a proxy for building location and to produce some modelling.