Valuation Office Open Data
Background
The Irish Valuation Office is responsible for valuing all commercial and industrial properties in Ireland. They are a very old institution, dating from more thn 70 years before the founding of the state. Primarily, their function supports the levying of “rates” or commercial taxes by Local Authorities to support provision of services.
Accessing the Data.
The Valuation Office api can be found here and is fairly straighforward to use. There is also a neat map interface to be found here. There is no facility to perform a bulk download of all the data, so I’ve scripted a process in R which can be found on my github site. I basically use a list of county names to iteratively call the api for each county name, then correct for some errors. I have also provided a onedrive folder with all the data from the analysis, link at the bottom.
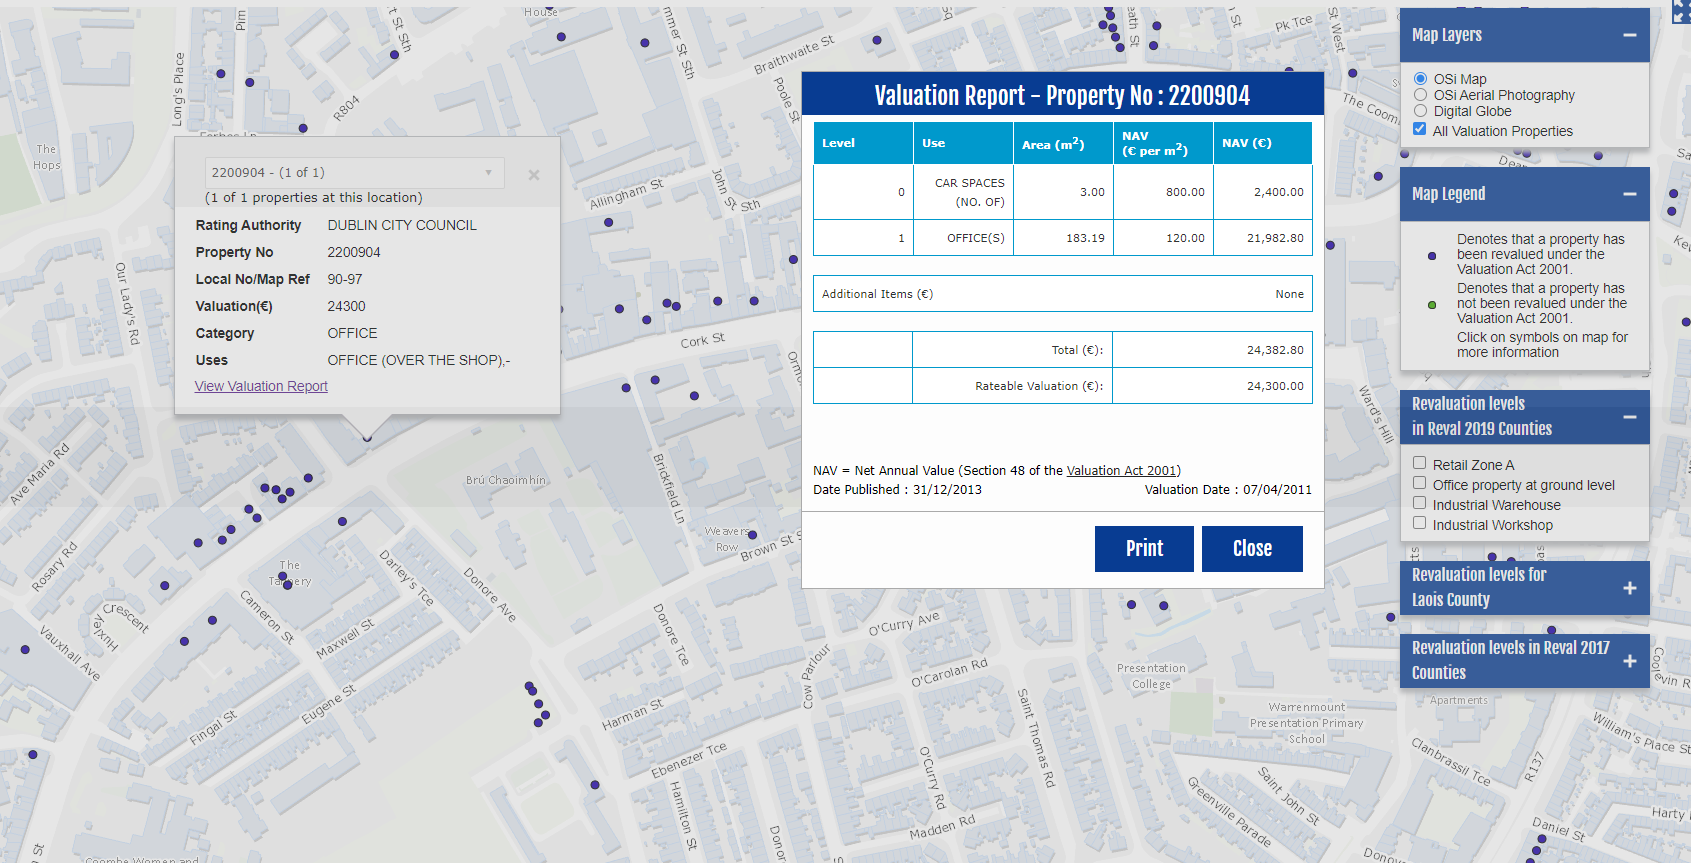
Valuation Office Mapping Portal
First Impressions
The entire dataset for available counties (some aren’t in this dataset - I think this is as the revaluation has not occured for these areas?) has a quarter of a million rows, and 20 columns. Some features:
Dublin is the most frequent county with 97541 rows
Property Number is the Unique Identifier for a valued premises but there may be more than one row, and each Property is broken into floors or valuation units (for example, a shop will have Retail A which is the higher valued space nearest the entrance, and Retail b and C, which would be deeper into the unit).
There is a Category variable, with 15 factors.
There is a Uses variable, which describes the different uses, or combinations thereof, of the premises.
The X and Y are in Irish Transverse Mercator 95, CRS 2157 if anyone plans on mapping the data.

Summary Information for first three columns of the Valuation Office Dataset.
This is a neatly presented dataset, and in its original format has good potential for analysis to be carried out on it. There are however some things to watch out for:
the hospitality category has all its data redacted, for commercial sensitivity purposes I have been informed.
There are some very large sites which somewhat skew the data if not accounted for.
Performing a comparison of the coordinates with Ordnance Survey Ireland building polygons shows that the location information can be a little inaccurate. It would be great if the properties were matched to OSI geoid in a manner like the brilliant Geoplace has been used in the UK.
It’s probably better to split this into two tables, with the floors normalised on the Property Number.
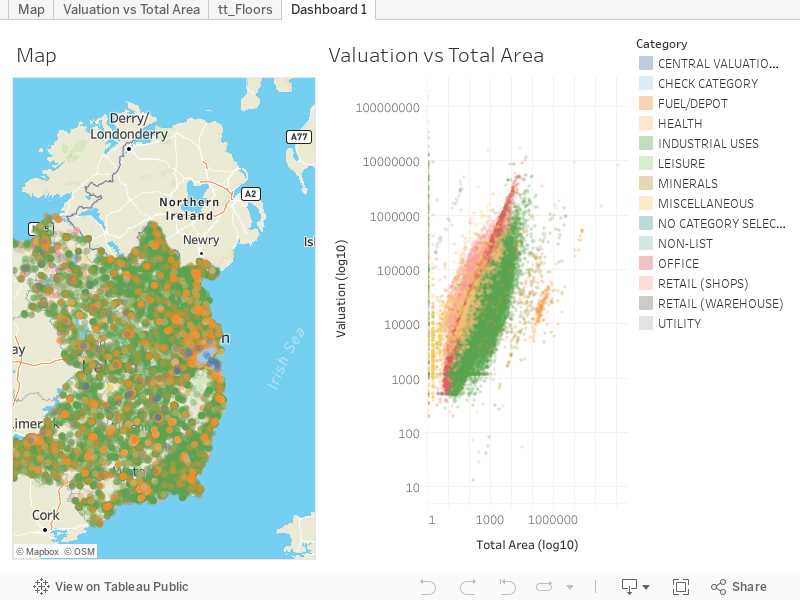
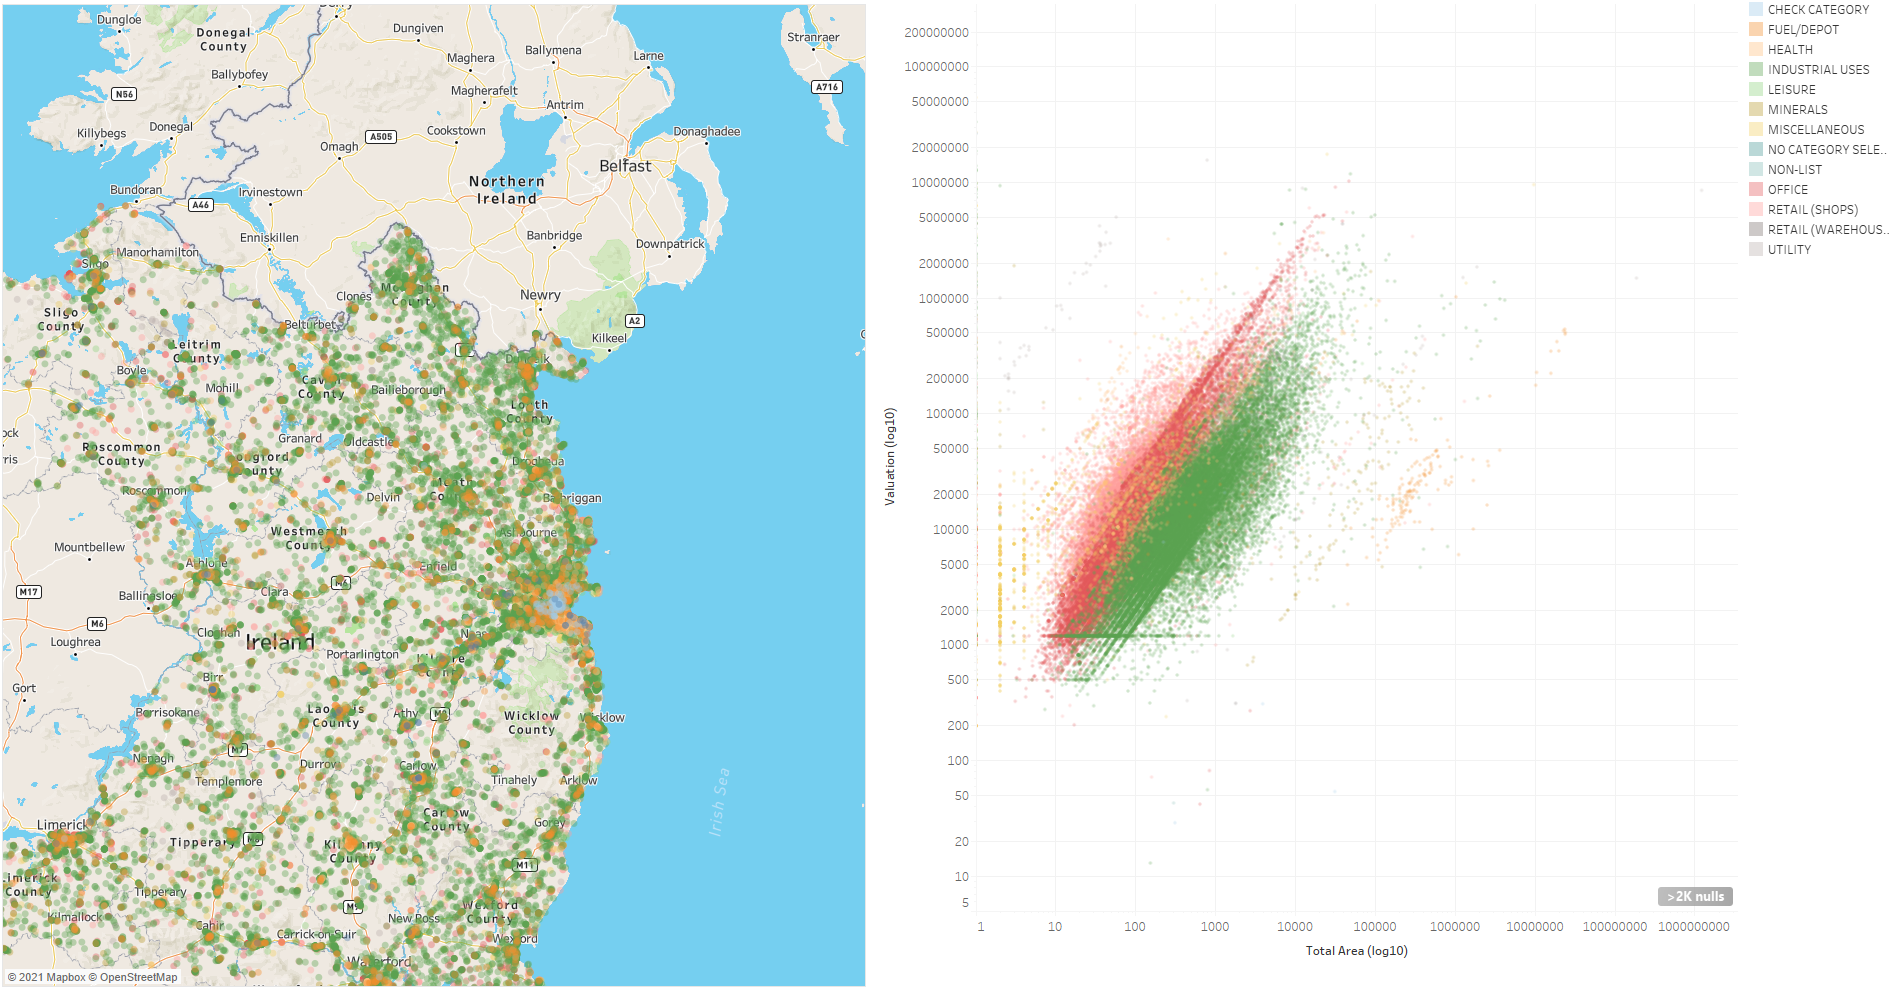
When we correct for the above issues, and normailse to Property Number, we get a table of 94614 properties. It might be useful to look at how the value relates to size and category.

Plot of Valuation vs Total Area, with Category as a colour dimension for Valuation Office Properties.
This plot shows that there are plenty of quality issues around the area and the valuation totals, even with correction for spurious negative values in these variables and also filtering for zero values. It;s fairly apparent that there is a fairly defined system for valuation of property, given the obvious banding in the dataset, which one might expect. It might be an interesting project to build a calculator to allow property owners to estimate their own valuation?
A static plot can be difficult to interrogate, so I have also made a Tableau online version of this plot. It has some additional visualisations also.
Verdict:
Good! There are some quality control issues, but its a pretty useful dataset overall, even if only for its descriptive value. Groundtruthing the data would be important, but overall you’d expect the information to be fairly accurate.