Demographic Clustering for Community Risk Reduction
Background
The Irish Central Statistics Office performs a census of poulation every five years. Since 2006, data has been aggregated to “Small Area” level - generally in or around 100 households. We have three Census (Censi??) at this level of aggregation, and they cover variables as broad and diverse as how many people of a certain age live in an area, to the proportion with internet access. The data can be accessed here.

Dublin eprivaton Index 2016 - https://maps.pobal.ie/WebApps/DeprivationIndices/index.html
Pobal, a state body that is concerned with improving social inclusion and development, publishes a Deprivation Index that is based upon the Census stastics - this is based on work by Haase and Pratschke, background can be found here. This shows the overall level of affluence and deprivation based on multiple indicators such as population change, education, unemployment, and the ratio of younger and older people to working age people. There is a widespread asumption that the Deprivation Index for an area can tell us a lot about likelihood of events happenning in an area, such as dwelling fires or crime.
However, there are issues with this assumption:
The Census is a snapshot in time, taken every five years. The results are generally released a year after the enumeration meaning that a lot can change within the intervening period.
An aggregation of 100 dwellings (at Small Area level, the smallest Census geography) is a relatively large area, with the potential for important indicators to be masked by the surrounding neighbourhoods.
The features that are used to produce the Deprivation Index (you can download a geoprofile of your own area here and see the features used - or see the example below) are those that the original designers of the index decided were most appropriate for measuring affluence / deprivation. As such, features that might be of interest for other predictions are not included - for instance, in an examination of fire risk indicators, the generation or type of housing could be incldued.
Example Geoprofile for Garristown, Co. Dublin
Extending this concept….
It might be useful to create a data product that includes some of the deprivation index variables, and also inlcudes others which might be of use. Given that the creators of the Deprivation Index were highly skilled and experienced social and economic analysts, it would be a stretch to try and replicate the skill and insight that they brought to the Deprivation Index. However, a branch of statistics, known as unsupervised learning may be able to highlight the key features of interest in the data, and show which Small Areas have most similarities - this is known as Cluster Analysis. The analysis is outlined on my github site for this project.
Outcomes….

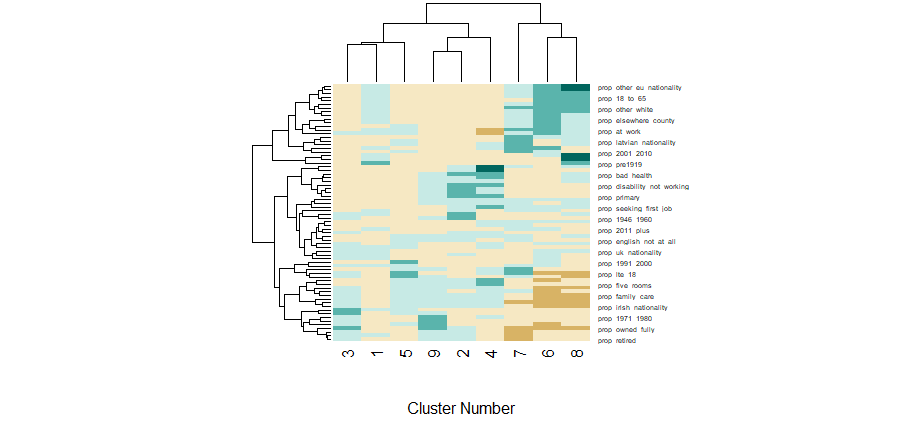
Shown above is the heat map of the 9 clusters identified, and the relative high or low proportions of the variable within that cluster. Clusters 6 and 8 have a characteristic that there is a relatively low proportion of people of Irish Nationality, in comparison to the other clusters.
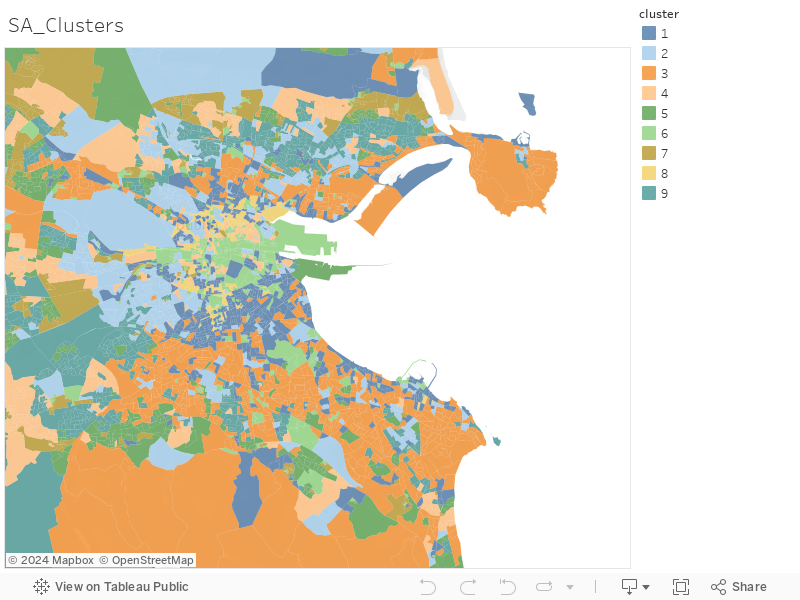
Shown above is a map of the Dublin Small Areas, colour-coded to the cluster which they were assigned to. I will leave it to the reader to tease out any patterns, as it is very easy to bring one’s own biases into interpreting these maps….. Hovering over the polygons shows the 10 strongest features for the cluster, with red indicating a low proportion, and blue a high proportion of that feature.
The full Tableau Workbook for this analysis can be found at https://public.tableau.com/profile/mick.o.donnell#!/
Conclusions
This type of clustering is useful in thinning out a dataset with many features into the most relevant for a given problem. The next logical step would be to see if there was any evidence of higher dwelling fire occurence per head of population for some of the clusters compared to the others.
Another useful outcome of this method is that the dominant features of the population in a given area are highlighted - the use of school fire safety programmes may not be able to reach a population that have a very low proportion of school-age children, for instance.

